 AI
BIRTH LOT: an AI-made SFC game where you live one life drawn from the UN's real numbers
This time the subject is a life simulation. Press A: a marker hops across the world map and stops where you are born. The draw uses each country’s real number of births: about 132 million babies are born each year, 23 million of them in India, 7.5 million in Nigeria and 130,000 in Taiwan, so your chance of being born in Taiwan is about one in a thousand.
Then the life moves on a year at a time. Whether you die in a given year depends on the real probability of death at that age, for your sex, in the country you were born in. School, work, marriage, children, moving to the city, going abroad, war and illness also follow local statistics, and some ask you to choose. When the life is over, if you had children, you can go on as your child, born where you last lived. Up to three generations; at the end the map shows your family’s path.
The game is called BIRTH LOT (出生籤), a 512 KB SFC cartridge. From the request to the finished game, the AI worked for about 50 minutes, about US$12 at API prices.
How it plays
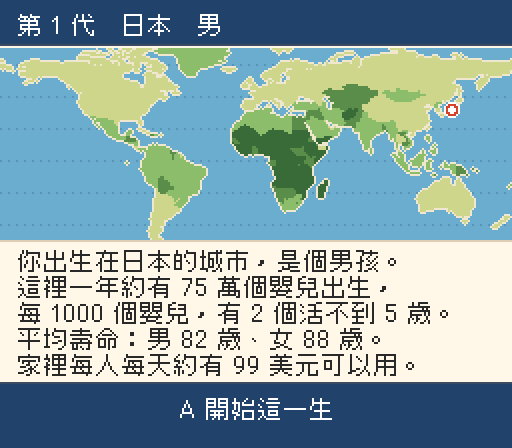
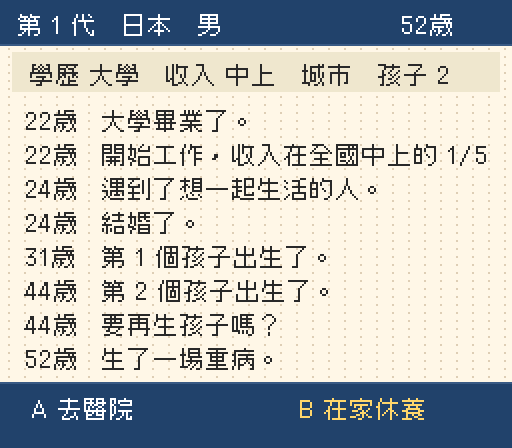
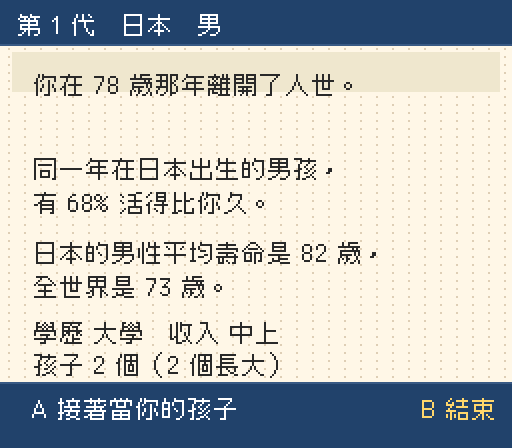
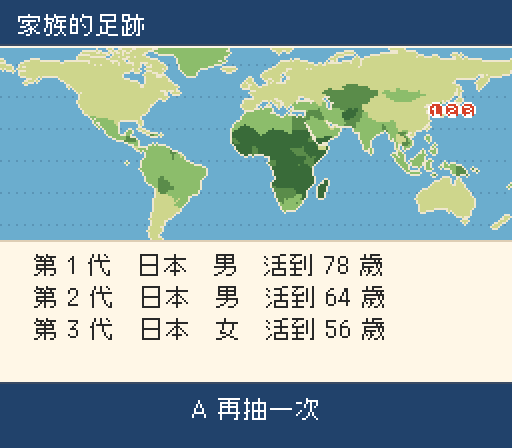
A life takes one to three minutes; three generations five to ten. The choices:
- School: after primary, lower and upper secondary school, keep studying or go to work? Wanting to study is not enough: the odds follow local enrolment and your family’s income.
- Marriage and children: marry the person you would like to live with? After two children, have another?
- Moving: in the countryside you hear there is more work in the city; some get one chance to work abroad, with the destination drawn by each country’s real net immigration.
- War and illness: flee or stay when fighting reaches home; hospital or rest at home when seriously ill.
Where the numbers come from
What matters most here is that the numbers are real. The AI first settled a source for each, then wrote programs to download the data and turn it into tables on the cartridge. It did not write a single number itself:
| Numbers | Source | Used for |
|---|---|---|
| Births, sex ratio at birth, life expectancy by sex, under-5 mortality, fertility, net migration | UN World Population Prospects 2024, year 2023 | The birthplace and sex, children, whether a child grows up, where people move |
| The probability of dying at each age (0-100, by sex) | UN WPP 2024 complete life tables | Life and death, every year |
| Primary and lower-secondary completion, tertiary enrolment, GDP per person, income by fifths, urban share, maternal mortality | World Bank WDI | School, the family’s money, city or countryside, the risk of giving birth |
| Battle deaths (mean of 2019-2023) | World Bank WDI (from UCDP) | Fighting reaching home |
| World map, country positions | Natural Earth (public domain) | The map (darker = higher birth rate) |
| Country names | Unicode CLDR, Traditional Chinese | Names on screen |
237 countries and territories in all. The complete life tables are the heart of the game: rather than estimating from life expectancy, it uses the UN’s own figure for “the chance that a person of this age and sex in this country dies within a year”. 237 countries × 2 sexes × 101 ages take about 140 KB on the cartridge.
Gaps: the World Bank has no data for Taiwan, and some small countries miss values. The AI filled them with the mean of the 5 countries closest in life expectancy and under-5 mortality, and marked them in the data file. So Taiwan’s schooling, income and urban share are estimates, while its births, death rates and life expectancy are the UN’s.
Which rules are the game’s own
Statistics only give averages. To let the player choose, the game needs rules, and those rules are not statistics. The AI wrote all of them down in the case notes so they can be checked, for example:
- The poorer the family, the higher the yearly risk of death (poorest fifth ×1.375, richest ×0.75).
- The richer the family, the easier it is to stay in school.
- After marriage, the chance of a child each year is the local fertility rate ÷ 20, so families in Nigeria are on average much larger than in Taiwan.
- Staying when fighting reaches home multiplies that year’s risk of death by 4.
These factors are game design, not research findings. In the real world income, education and lifespan are linked, but how strongly varies from place to place.
How we checked the game gets it right
The numbers being right is not enough; the program has to use them right. The AI wrote a checking tool that plays 300 lives in the emulator (random choices) and compares them with the data:
| In the game | In the data | |
|---|---|---|
| Born in India | 17.3% | 17.6% |
| Born in China | 6.3% | 6.7% |
| Born in Nigeria | 7.0% | 5.7% |
| Died before 5 | 3.0% | 3.7% |
| Mean age at death | 70.1 years | life expectancy weighted by births: 70.3 years |
With 300 lives the sampling error is about ±1-2 percentage points for the shares and ±1.2 years for the mean age, and every difference is within it. The comparison is with life expectancy weighted by births, 70.3 years, not the world’s 73: more babies are born where lives are shorter, so a newborn can expect fewer years than the average of the world’s population.
On the SFC
- Screens: a 256×96 world map at the top, drawn from Natural Earth’s borders into 225 tiles; the marker is a sprite. Text works as in our word-card game: the whole screen is drawn in memory and then sent to video memory. The Chinese font is the Cubic 11 pixel font.
- Each year: the program looks up the life table for life or death, then decides what happens that year from the age and the probability tables, and redraws the record. With A held, a year takes about 0.2 s.
- Music: a quiet loop in F (zither, flute, bass), written in MML with our sfc-make tools.
- Size: about 2,600 lines of 65C816 assembly; a 512 KB ROM, of which 15 KB are glyphs and 140 KB life tables.
What it cost
| AI working time | about 50 minutes |
| Model | Claude Opus 5.5, the main session plus 2 sub-agents, about 130 replies |
| AI output tokens | about 170,000 |
| Tokens processed | about 30 million (mostly cache reads) |
| Estimated cost | about US$12 (at Anthropic API prices, November 2026; subscriptions are billed differently) |
| Anything else | nothing: the data, map and font are public or openly licensed |
For teachers
- No gore. Death, war and illness happen at real rates but are told in one line; suicide and violence are not in the game.
- The statistics describe 2023, and the game’s world does not change with time: your child is born into the same numbers.
- A round takes minutes. Let every student draw once, then compare: where were you born, how long did you live, how far did you get in school?
To make your own game with AI, run npx https://aixsfc.app/skill/aixsfc.tgz in an empty folder and start claude;
see the home page.
Sources and licences
- Population and mortality: United Nations, World Population Prospects 2024, CC BY 3.0 IGO.
- Education, income, urbanisation, maternal mortality, battle deaths: World Bank, World Development Indicators, CC BY 4.0 (battle deaths from UCDP).
- Map: Natural Earth, public domain.
- Font: Cubic 11, ACh-K, SIL Open Font License 1.1.
- Code, text, map drawing, music: made from scratch for this game. Not affiliated with or endorsed by Nintendo.